Putting Numbers on Fuzzy Risks: The FAIR Approach
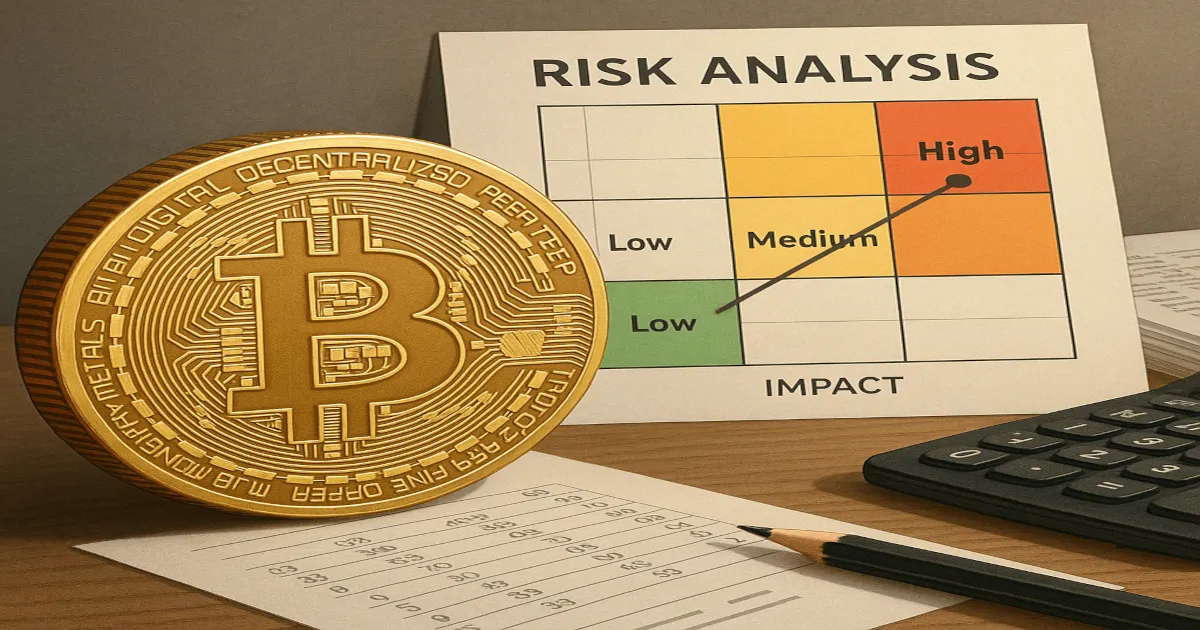
Talking about computer security risks often feels fuzzy. People throw around terms like “High,” “Medium,” and “Low”. They show you heat maps with scary red squares. But what does “High” risk mean? How much more dangerous is “High” than “Medium”? How do you decide where to spend money based on colors? It often feels like guesswork dressed up in fancy words.
Business runs on numbers. If you want money for a new project, show how it will make or save money. Try asking for a budget based on a red square on a heat map. It doesn’t work very well. You need to speak the language of business: euros and cents.
A Standard Way is FAIR
There’s a way to do this for information risk. It’s called Factor Analysis of Information Risk, or FAIR. It sounds complicated, but the core idea is to turn fuzzy risks into numbers you can use. It’s not just some random idea someone cooked up; Factor Analysis of Information Risk (FAIR™) is the only international standard quantitative model for information security and operational risk. That means experts have looked at it, debated it, and agreed it’s a solid, logical way to think about risk. It gives you a structured way to think about how often bad things might happen and how much they might cost when they do.
Breaking Down Risk In Frequency and Magnitude
The basic idea in FAIR is that risk equals the frequency of a loss multiplied by the severity of the loss. Simple enough. However, the real value comes from how FAIR breaks these two things down. First, let’s look at how often losses happen. FAIR calls this Loss Event Frequency (LEF). It’s not just about how often bad guys try things but how often they succeed in causing a loss. To figure this out, FAIR makes you think about two sub-parts. One is Threat Event Frequency (TEF): How often do the bad guys (or bad events, like system failures) show up and try to do something harmful? This involves thinking about how often they make contact and how likely they are to act when they do. The second part is Vulnerability: When the threat does act, what’s the chance it succeeds? This isn’t just about software flaws. In FAIR, vulnerability means how likely your defenses (your controls, your processes) are to fail against that specific threat’s capabilities. So, LEF is TEF times Vulnerability. If threats try often, but your defenses are strong (low vulnerability), the loss frequency might still be low.
Second, FAIR tackles how bad the loss is. It calls this Loss Magnitude (LM), measured in money. Again, it breaks this down to ensure you don’t miss things. There are primary losses, which are the direct hits your company takes. This includes things like lost productivity because systems are down, the cost of responding to the incident (paying experts, overtime), the cost of replacing damaged equipment, any fines or legal judgments you have to pay immediately, loss of a competitive secret, and even direct hits to your reputation that cause immediate financial loss. Then there are Secondary Losses. These are the ripple effects, the costs that come later because other people (customers, regulators, partners, the media) react to the initial event. Customers could be leaving because they don’t trust you anymore, regulators launching costly investigations, needing a big PR campaign to fix your image, or facing class action lawsuits. Sometimes, these secondary losses can be even bigger than the primary ones. FAIR forces you to think about the chance these secondary things will happen and how much they might cost.
An Example Is The Geopolitical Cloud Risk
Let’s apply this thinking to a real risk that is hard to pin down. Imagine you run a European company. You rely heavily on US cloud services, AWS for infrastructure, Microsoft 365 for daily work, and Azure for specific applications. Your operations depend on these services being reliable and affordable. Now, imagine the political winds shift in the US. A Trump administration, or even a different one, decides to get tough on trade with Europe. Suddenly, there’s talk of new taxes on digital services or regulations that make it harder or more expensive for US tech giants to serve European customers. Access may even get disrupted in a worst-case scenario. This isn’t a hacker trying to break in; it’s a geopolitical shift threatening your core operations. How do you quantify that using FAIR? You start by defining the asset at risk: your reliable, affordable access to critical US cloud services. The threat is within the political conflict, which leads to unfavorable taxes, regulations, or disruptions. The effect you worry about is losing access or facing drastically higher costs.
FAIR asks you to estimate the two key parts using its structure. How often is this bad thing likely to happen (LEF)? Predicting politics is messy. You’d look at current political rhetoric, historical patterns of trade disputes, and analyses from political experts. You wouldn’t get a perfect number. FAIR encourages using ranges to capture this uncertainty. Maybe you estimate the chance (Vulnerability, in FAIR terms, given the political’ threat event’ occurs) of a truly disruptive policy impacting your services within the next year is between 2% and 10%. It feels low, but not zero. You’d also need to estimate how often such a political’ threat event’ (TEF) might arise.
Then, you estimate the cost if it does happen (LM). FAIR pushes you to think broadly here. What are the primary costs? Scrambling to migrate systems (€€€), lost productivity (€€€), potentially much higher fees (€€). What about secondary costs? Reputation damage leading to lost customers (€€€€), potential penalties (€€), legal fees (€€)? Adding it all up, again using a range, the total financial hit could be anywhere from €2 million to €15 million.
From Numbers to Decisions
Now, you combine frequency and magnitude. Even a relatively low probability, say 5% overall chance per year (LEF), of a massive cost, say an average of €8 million (LM), points to a significant underlying risk. A simple calculation suggests an average expected loss of €400,000 per year (€8 million * 5%). Seeing a number like that, even as a rough range, changes the conversation. Is it worth spending €200,000 now on developing a multi-cloud strategy with a European provider as a backup? Or investing in tools that make migration easier? The quantified risk gives you a basis for making that decision, comparing the cost of mitigation against the potential financial hit you’re trying to avoid. It moves the discussion away from vague worries about political headlines towards a concrete business case.

Not Magic, But Clarity
FAIR isn’t magic. It relies on estimates, and estimates involve judgment. You need data where you can get it and reasoned, calibrated guesses from knowledgeable people where you can’t. Getting good estimates takes practice. But the process itself forces clarity. It makes you break down a complex, fuzzy problem like geopolitical risk into components you can think about and assign numbers to. It makes your assumptions explicit. Instead of just saying the risk feels “Medium” or “High,” you have to articulate why you believe the frequency and magnitude fall within certain ranges based on the factors FAIR defines.
It turns a worrying possibility into something you can analyze and discuss using the language everyone in business understands: money.
And that’s far more useful than just staring at scary colors on a map.